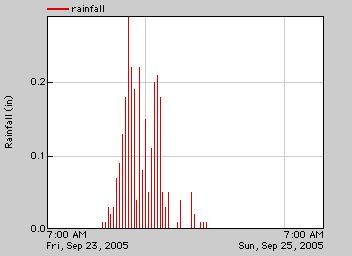
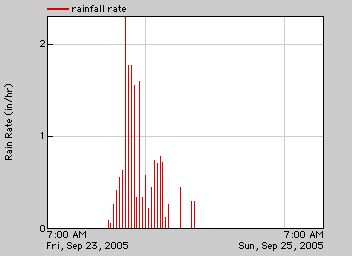
Four station records show Rita’s wind, pressure, and rainfall effects at Pirates Beach as the storm passed roughly 100 miles northeast of Galveston.

Technical support: Rusty Ross

Wind

Speed and gust level

The wind-speed line is a ten-minute average. The red gust line better shows the changing peak winds.

A large house immediately north of the station may have blocked some wind, though the minor local damage suggests winds likely remained below 60–65 mph.
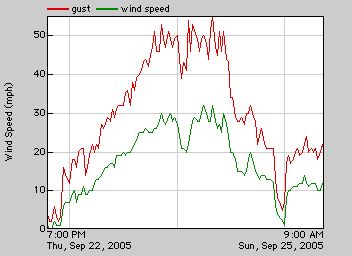
Hurricane Rita wind speed and gust chart

Pressure

Barometric pressure

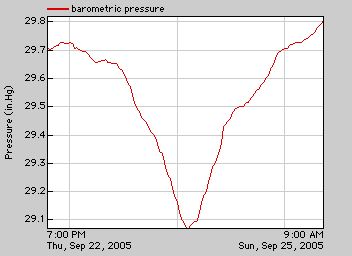
The lowest pressure closely coincides with the maximum winds. Converted from inches of mercury, the minimum was about 985 millibars.

That reading is consistent with the storm center passing about 100 miles to the northeast.

Hurricane Rita barometric pressure chart

Precipitation

Rainfall

This chart records rainfall during each ten-minute period. The maximum was slightly above one-third inch.

Total rainfall during Hurricane Rita was approximately 2.8 inches—significant, but not extraordinary.

Hurricane Rita ten-minute rainfall chart

Intensity

Rainfall rate

This chart shows the hourly rainfall rate calculated over each ten-minute period.

Rates between 1 and 2.25 inches per hour were heavy, but not extraordinary.

Hurricane Rita rainfall-rate chart

Assessment

A significant but moderate event

With Rita’s center making landfall about 100 miles northeast, Pirates Beach experienced moderate wind and rain. A five-to-seven-foot storm surge caused beach erosion and removed much of the sand covering the dune socks, but remained low enough that they prevented home flooding.

Galveston was extremely fortunate that Rita followed a more northerly path. A closer pass would have been catastrophic for the island’s West End.

View Rita photos